Spotify Artist Network Visualization
Mapping musical connections through network analysis and web scraping
Network Visualization Example
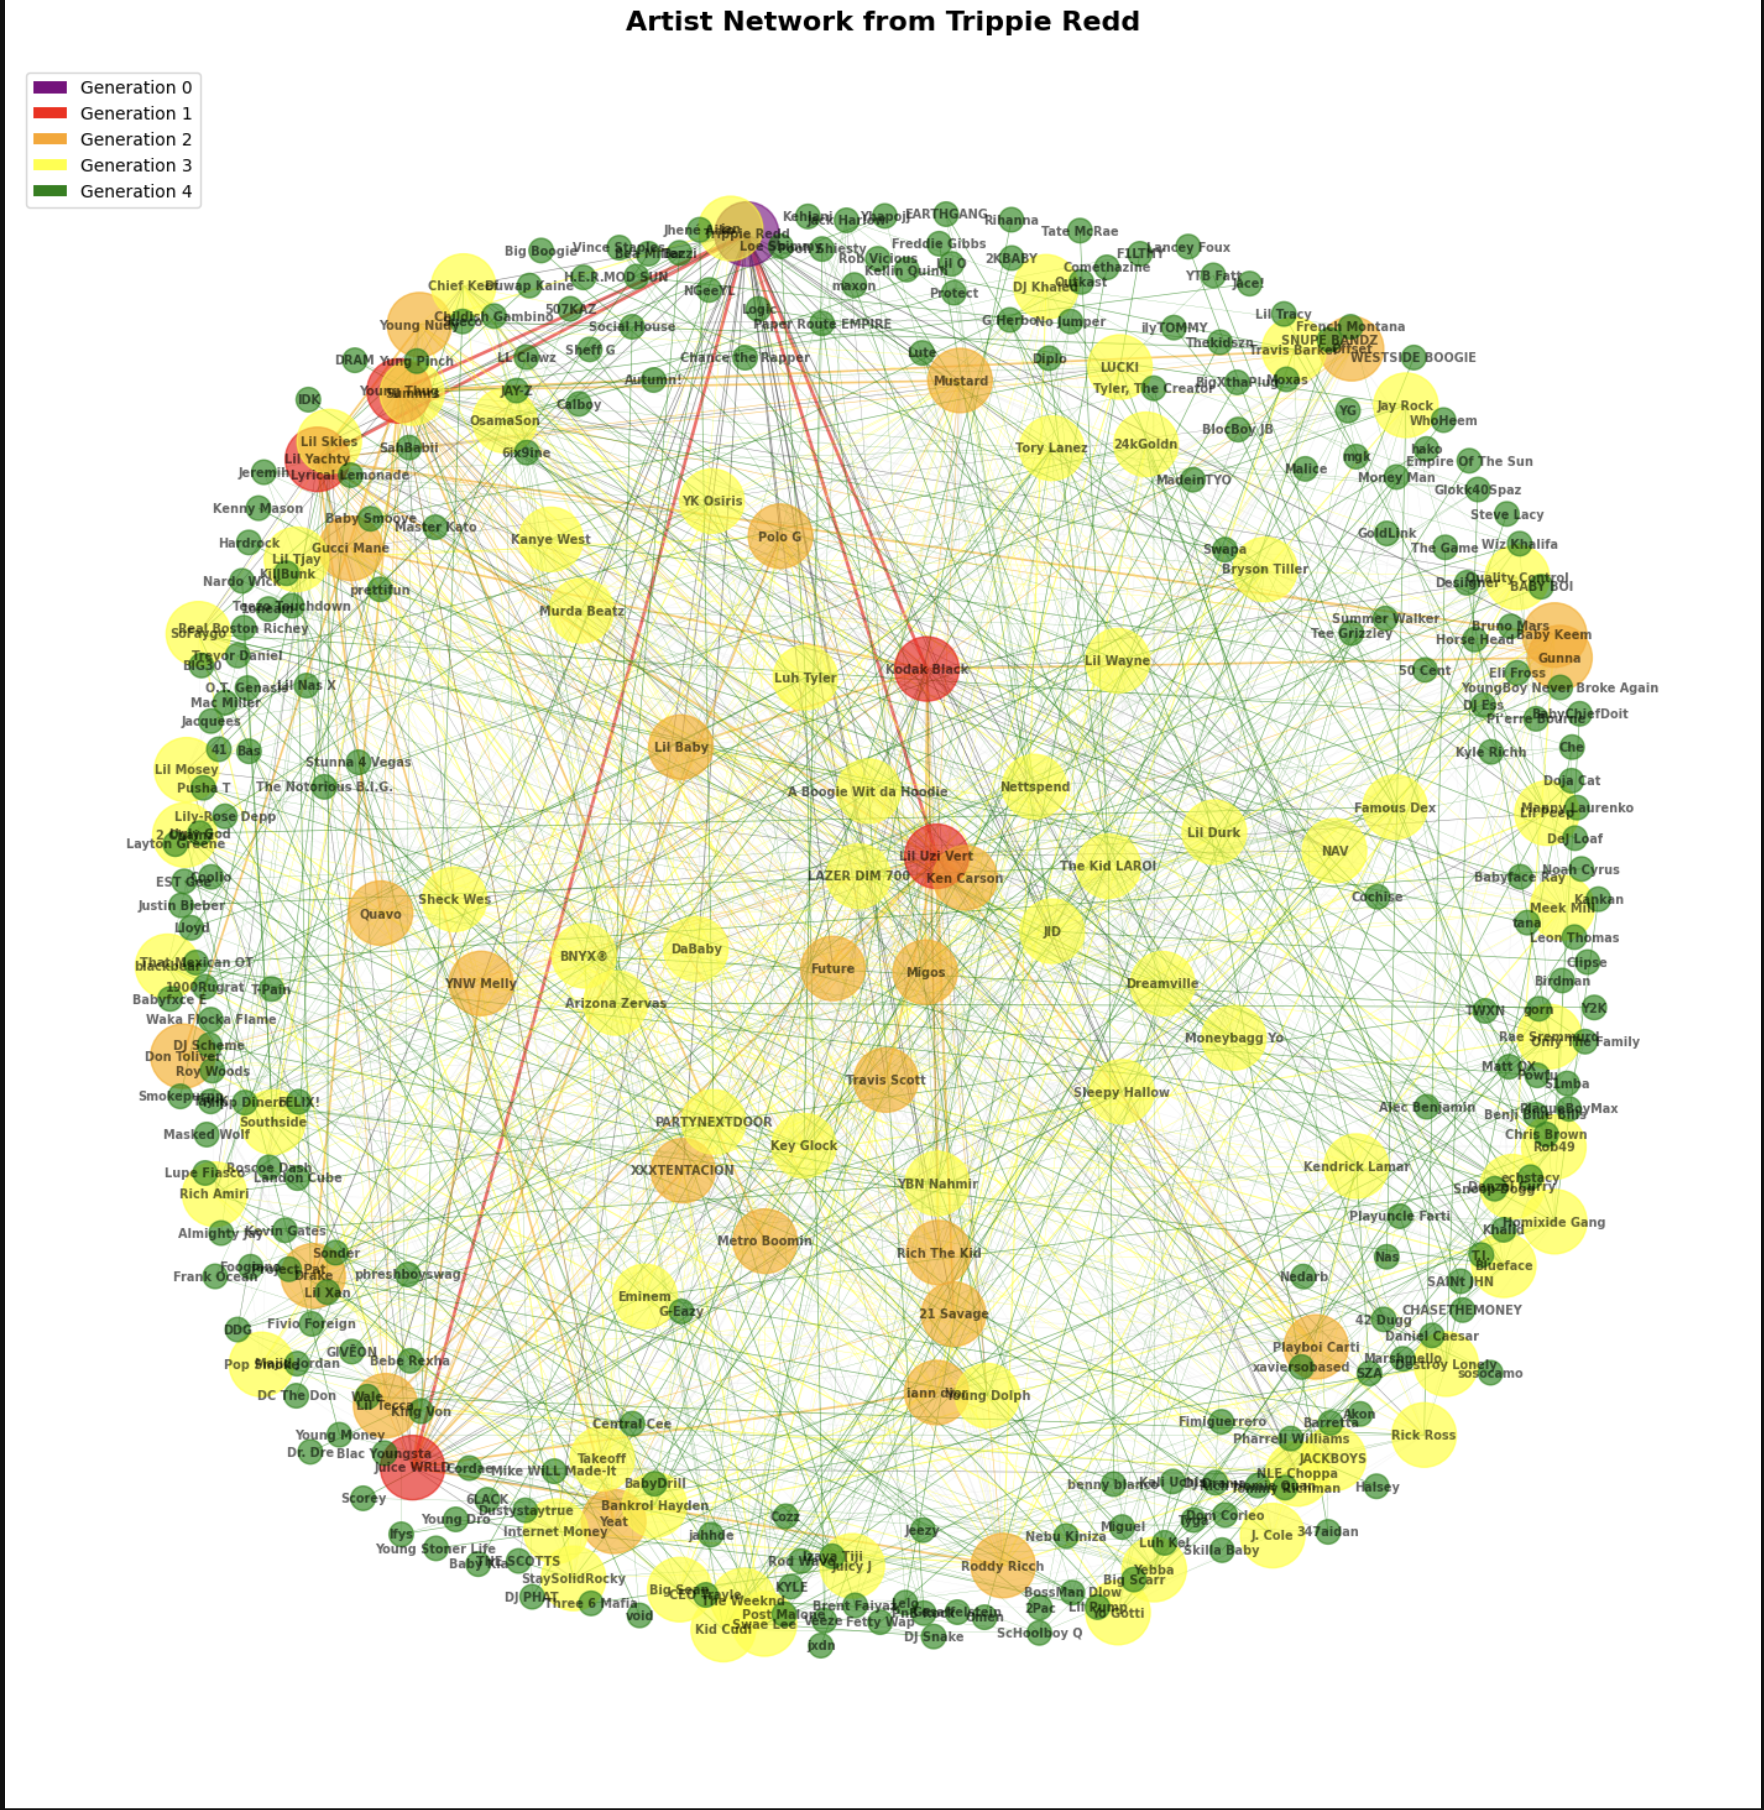
Interactive network showing 200+ artists across 6 generations from Coldplay
Project Overview
This project creates interactive network visualizations of artist relationships on Spotify, revealing hidden connections and musical communities. Starting from any artist, the system explores outward through “related artists” to build a comprehensive map of musical connections spanning multiple generations.
Automated Data Collection
Web scraping with Selenium to gather artist relationships from Spotify’s “Fans also like” section, building networks of hundreds of interconnected artists.
Multi-Generation Mapping
Explores connections up to 6 degrees of separation, with color-coded generations showing how musical influence spreads through the network.
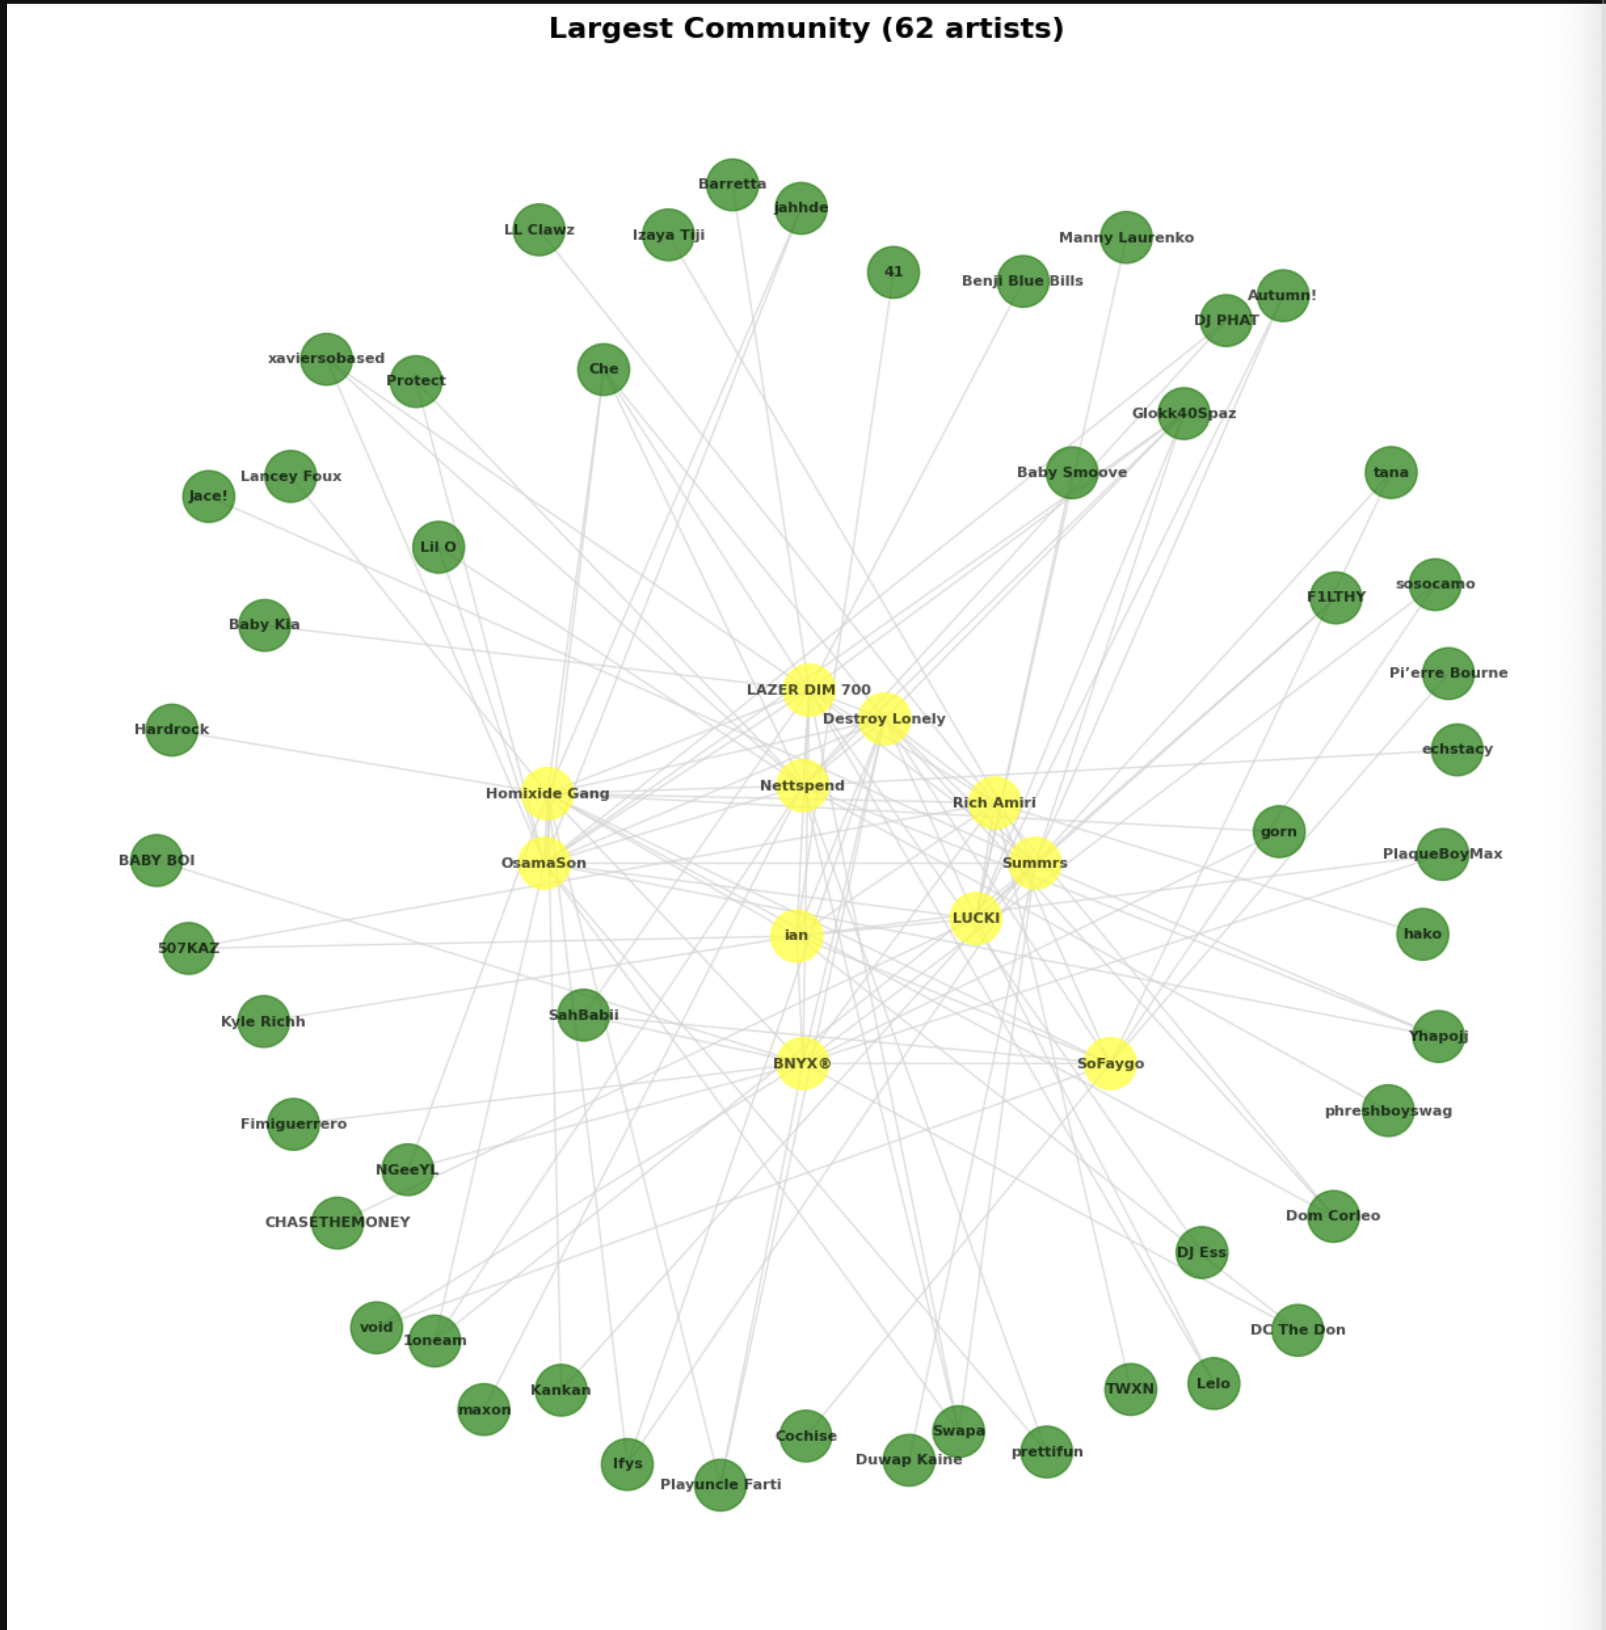
Community Detection
Implements Louvain algorithm to identify genre clusters and musical communities within the broader network structure.
Dynamic Visualizations
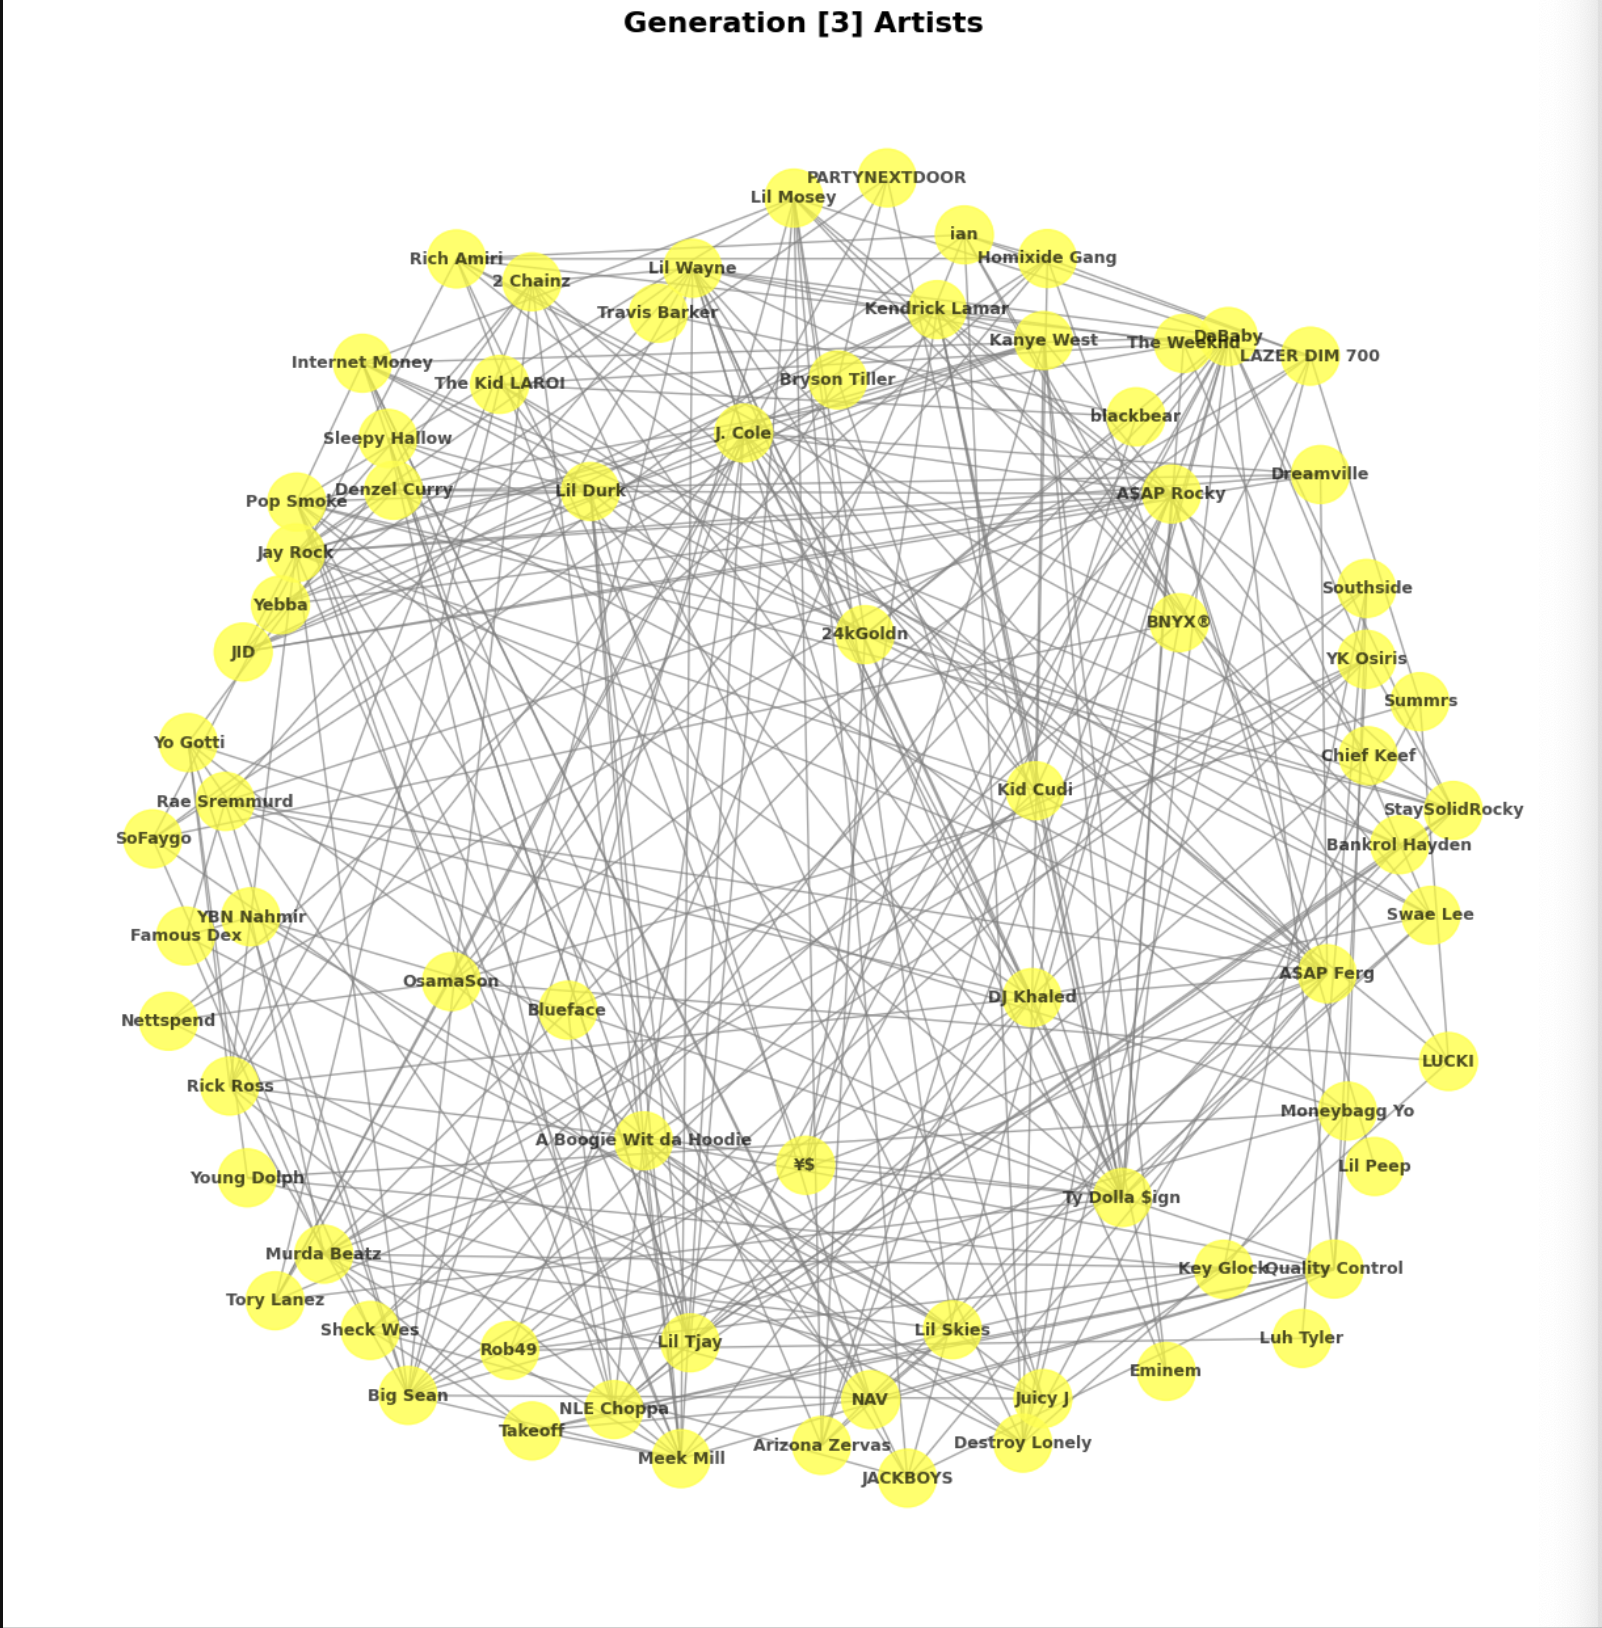
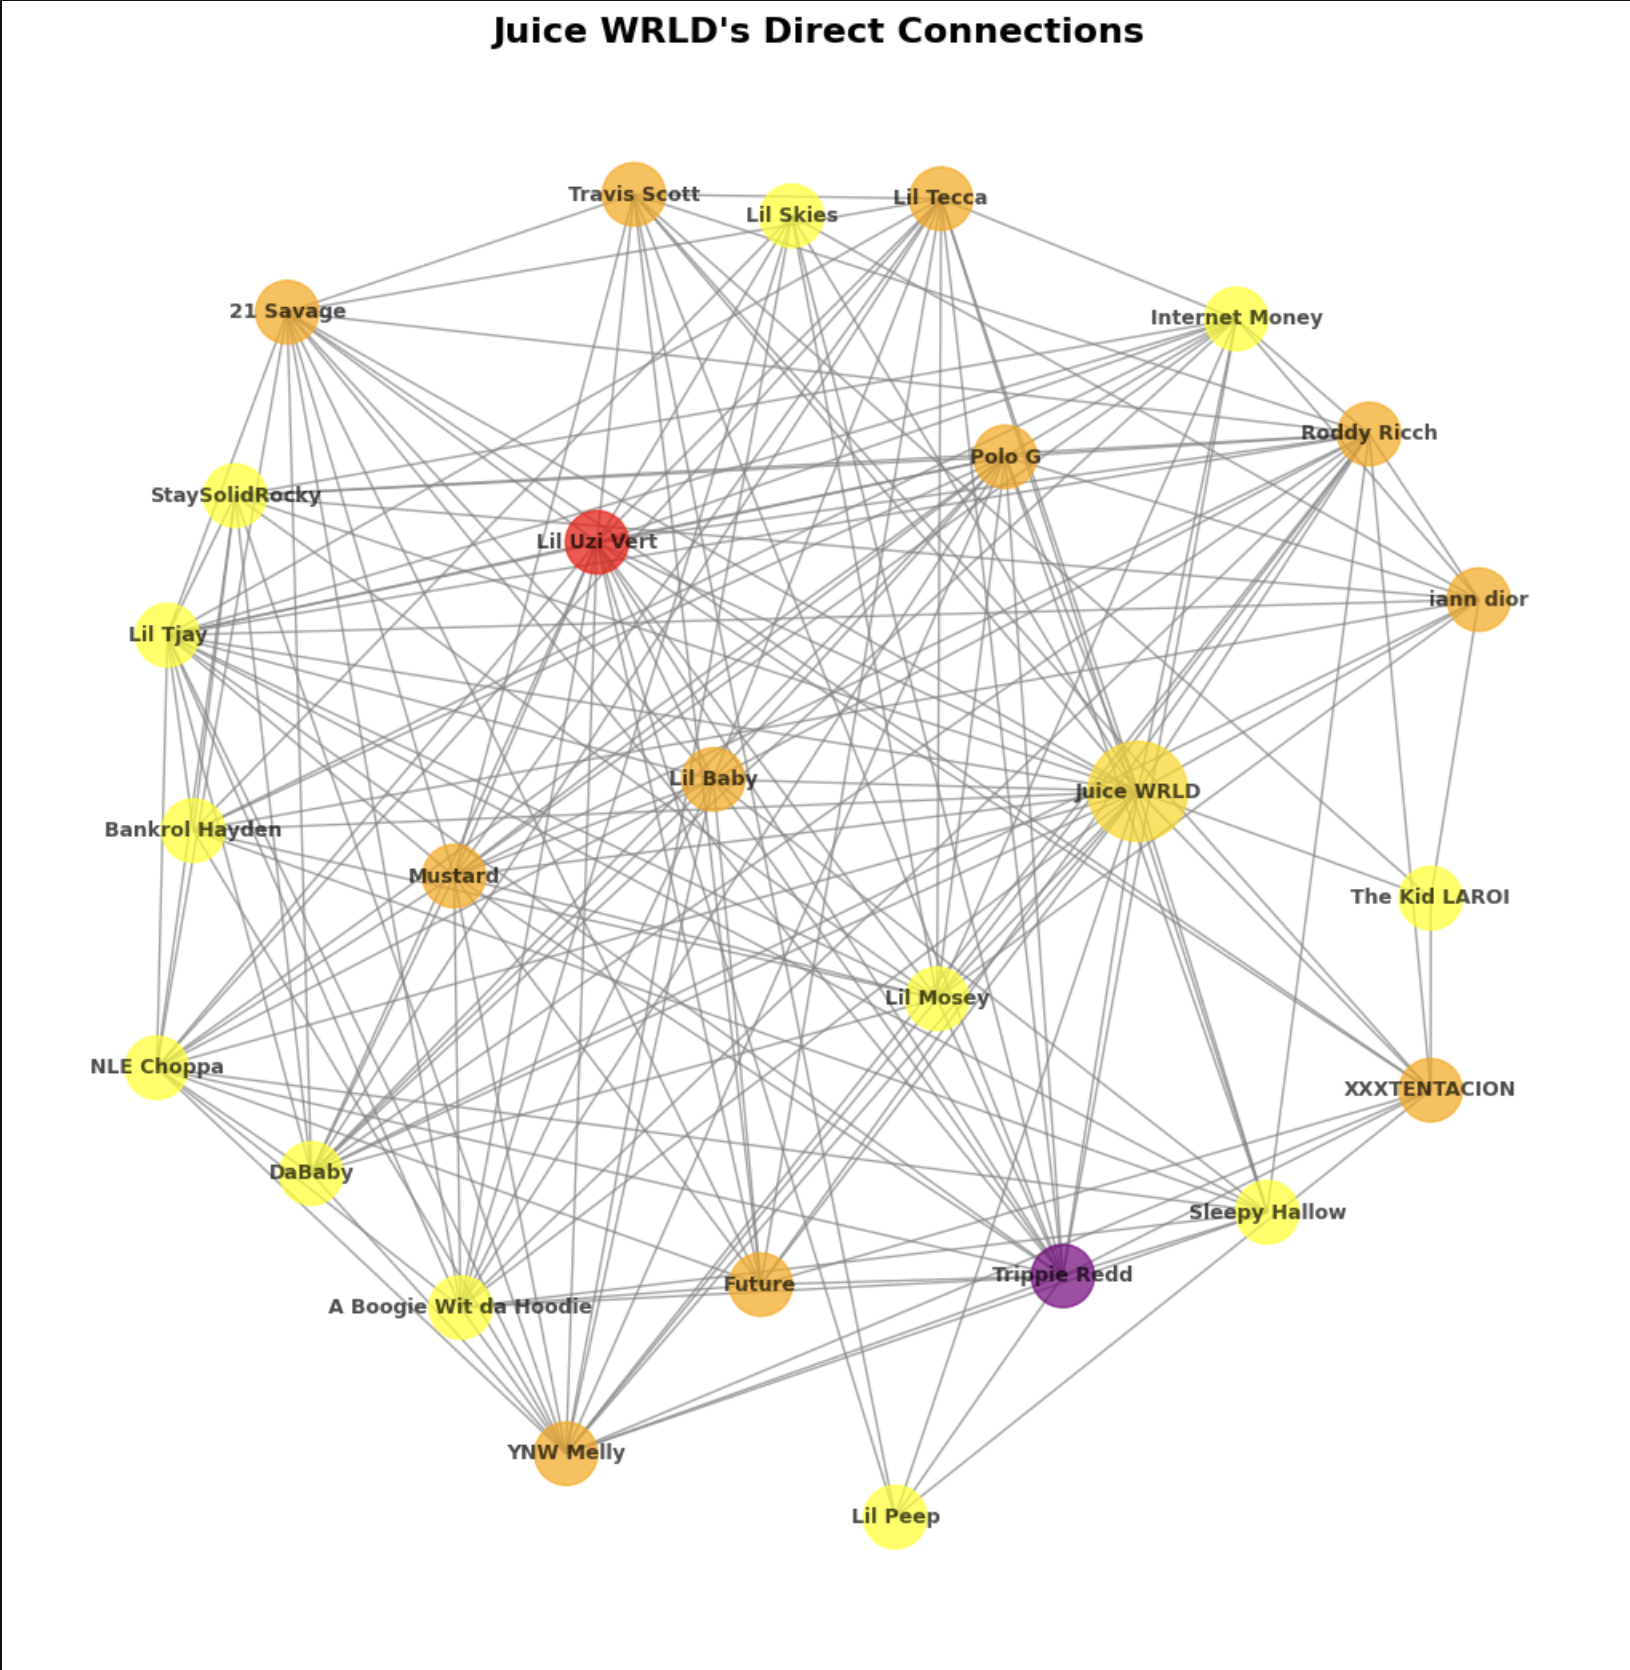
Interactive subgraph analysis including ego networks, generation-specific views, and shortest path calculations between artists.
Analysis Methods
Technical Implementation
Data Collection Pipeline
- Spotify API integration for initial artist search and metadata
- Selenium WebDriver for scraping related artist connections
- Breadth-first search algorithm to explore network layers
- CSV storage for data persistence and reusability
Visualization Techniques
- Node sizing: Proportional to number of connections (degree centrality)
- Edge weights: Exponentially decreasing by generation distance
- Color mapping: Distinct colors for each generation level
- Spring layout: Force-directed graph positioning for natural clustering